Business dashboards and automated reports
Sales, production, stock or programme numbers that are always up to date, on one screen. No more copying data into Excel at month-end — reports send themselves.
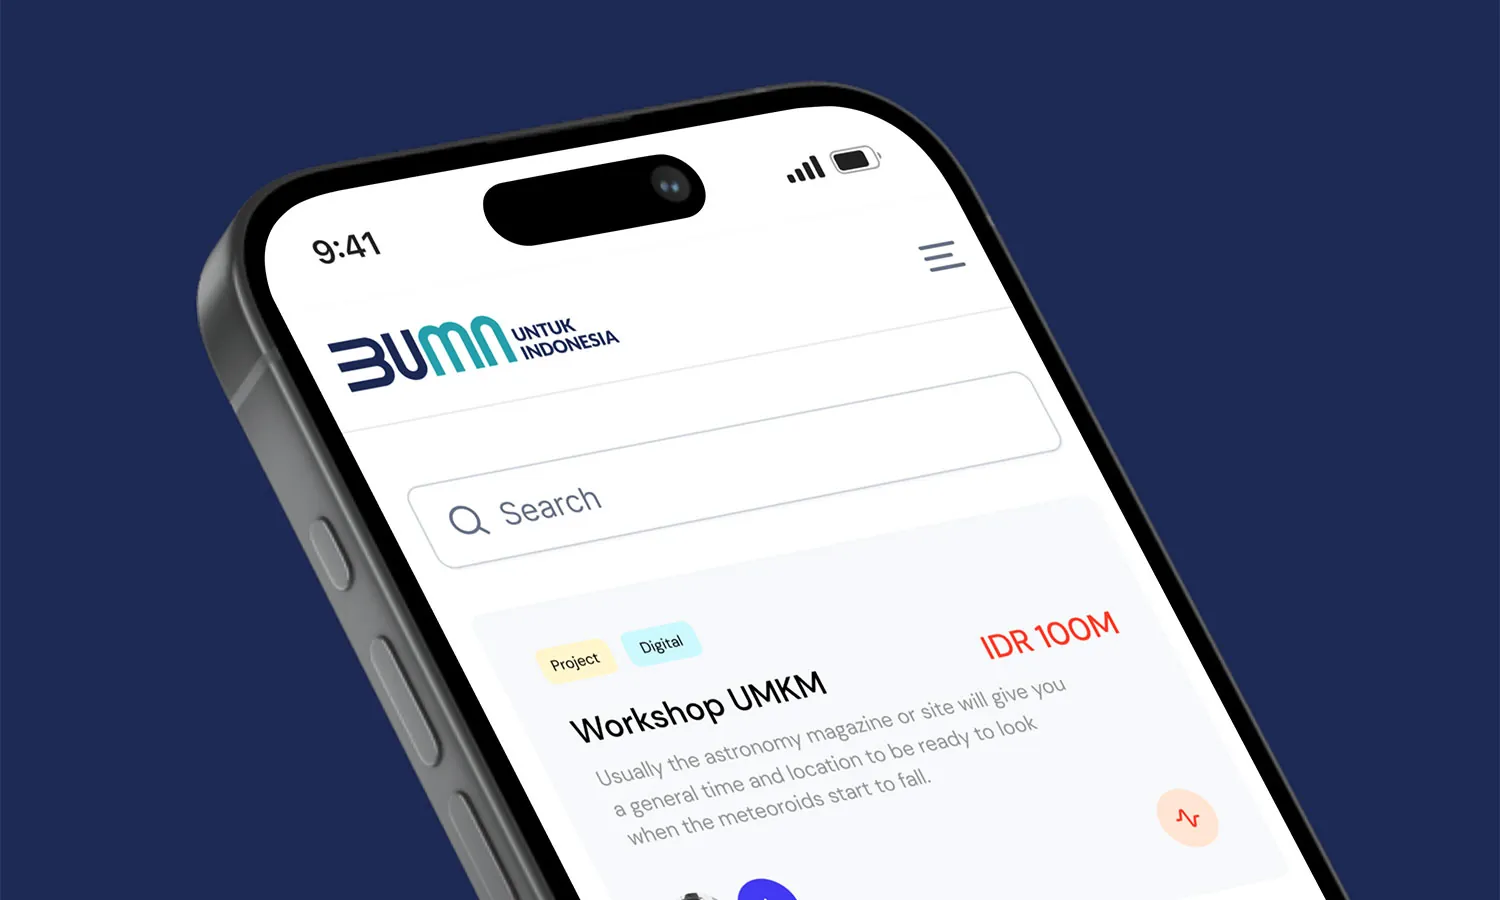
From scattered data to one clear picture
Most companies already have the data. What's missing is a fast way to see it.
Always current
Data is pulled automatically from your systems, not copied by hand.
Role-based access
Directors see the summary; managers see their team's detail.
Reports that send themselves
PDF or WhatsApp/email summaries every morning, week or month.
What's included
From finding the right numbers to a dashboard used every day.
Data source mapping
Excel, databases, ERP, Google Sheets, APIs or legacy systems.
Visual design
Charts that are easy to read, not just numerous.
Data automation
Data refreshed on a schedule or in real time.
Login & permissions
By role, branch or region.
Automatic PDF reports
Sent to email or WhatsApp on schedule.
Three languages
Indonesian, English and Chinese for mixed teams.
A dashboard for every part of the business
Start with one dashboard, then add more as needed.
Sales & finance
Daily revenue, team targets, receivables and cash flow on one screen.
Production & warehouse
Output per line, machine efficiency, raw-material stock and order status.
Programmes & projects
Fund disbursement, activity results and regional reports for SOEs, NGOs or agencies.
Retail & branches
Compare outlets, best-selling products and peak visitor hours.
Marketing & SEO
Keyword rankings, clicks and visitors from Google, with automatic PDF reports.
Real-time monitoring
Command centres for events, operations or crowds, updated by the second.
Dashboards we've built
From SOE programmes to store analytics.
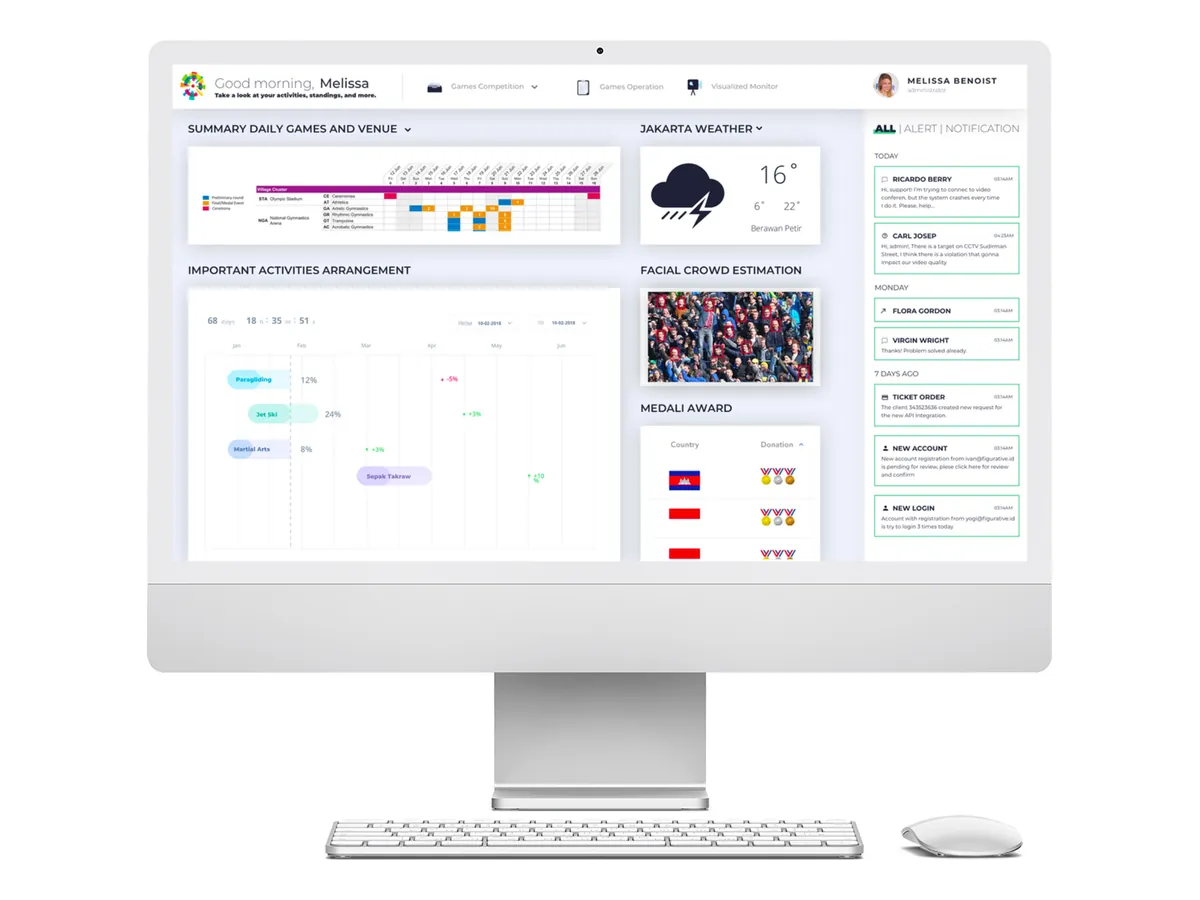 Proof of concept
Command Center
A proof-of-concept command-centre wall for monitoring operations in real time on one screen.
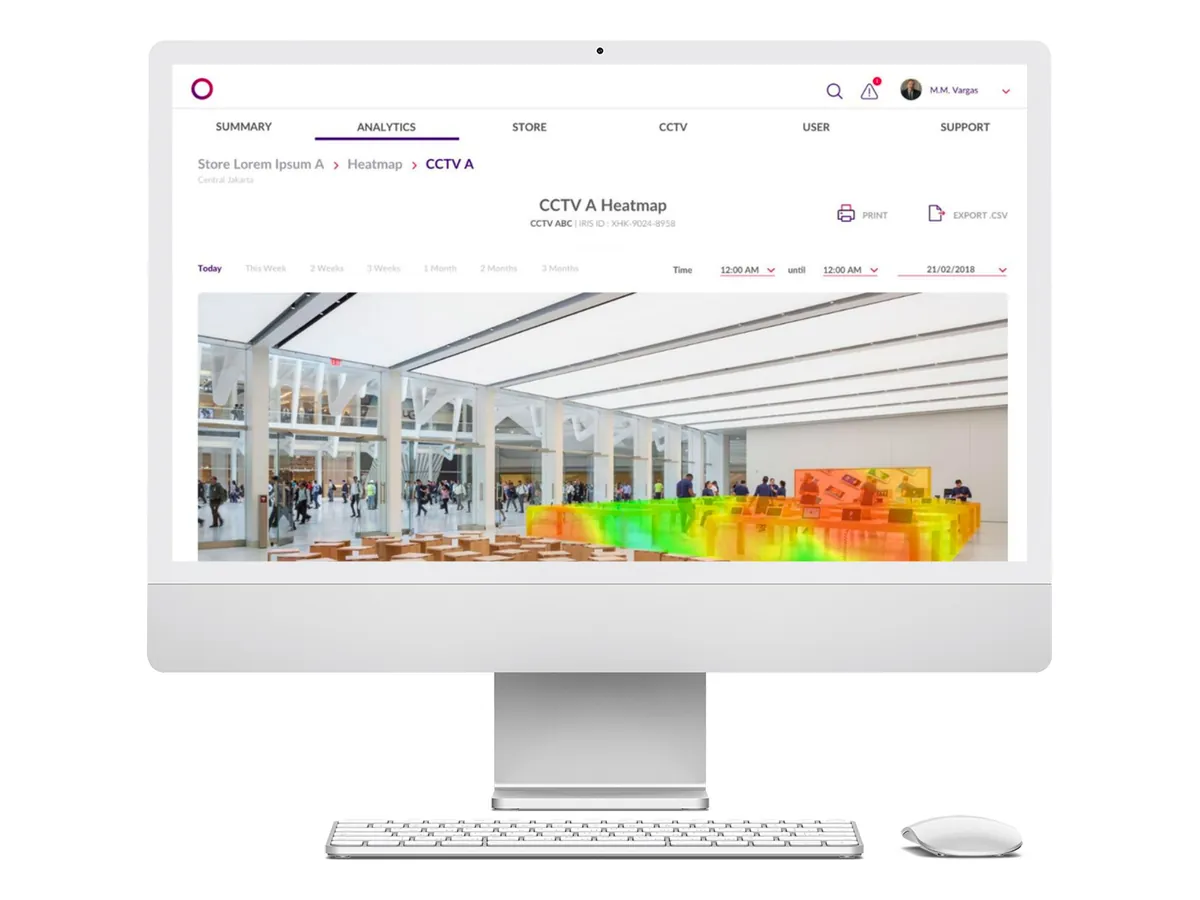 Retail · Vision AI
Store Crowd Analytics
A monitoring dashboard for a vision-AI company: store analytics, heatmaps, customer flow, product ranking and CCTV management.
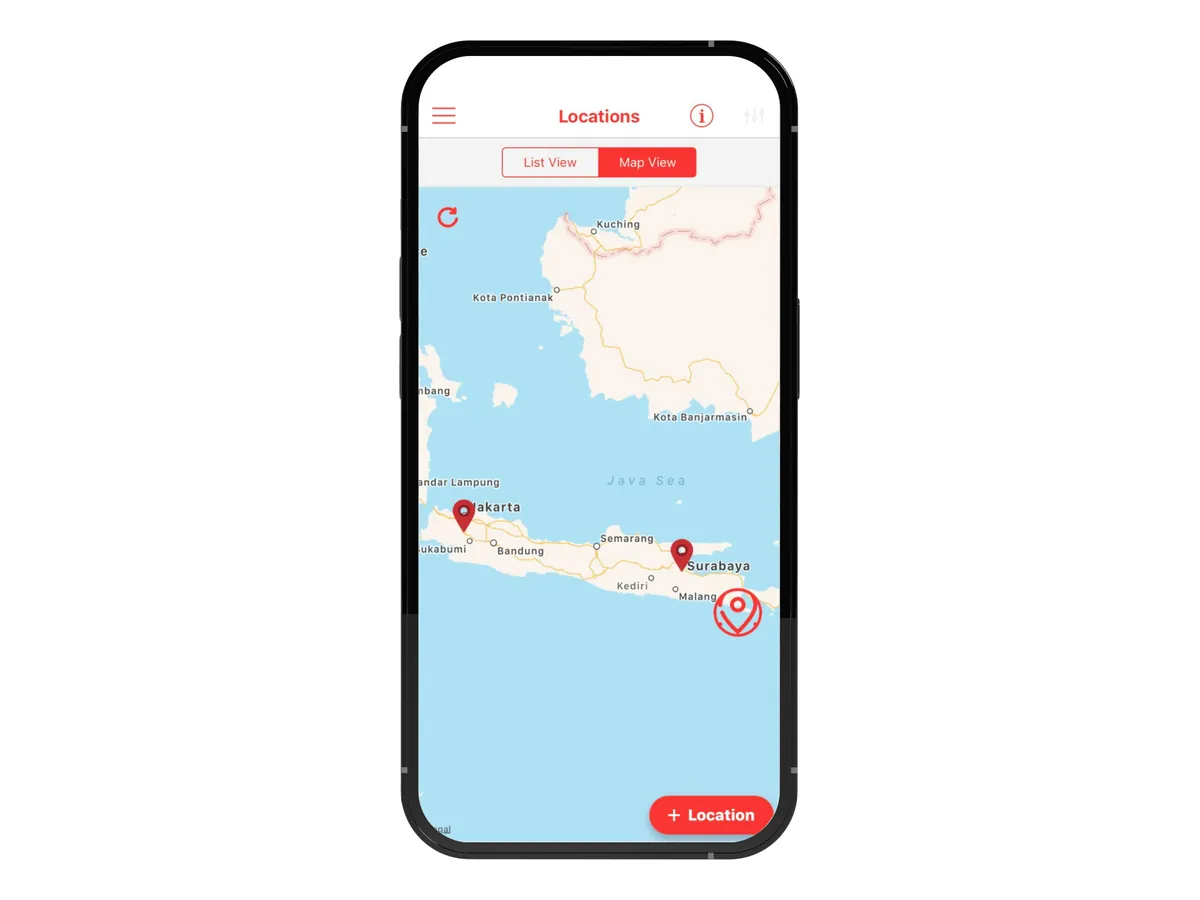 Industrial · IoT
Industrial Supply Chain App
Tracks delivery tasks, machine locations and health, the asset database, and service calls when a machine needs attention.
Clear from the start, visible at every step.
Discovery
We learn your business goals, users and workflows, then write a clear scope.
Requirements & estimateDesign & prototype
Key flows and screens are designed and clickable before any code is written.
Interactive prototypeIterative development
Built in sprints. You try the work regularly and give feedback.
Regular demosTest & launch
Functional, security and speed testing, then release to your server or the app stores.
User trainingCare & growth
We monitor, fix and add features as your business grows.
Long-term supportWhat you get
- An agreed list of key figures (KPIs)
- Connections to your existing data
- A responsive web dashboard
- Filters by period and branch, with comparisons
- Scheduled automatic reports
- Training and support
Technology
Can it use data from Excel?
Yes. We can start from the Excel or Google Sheets you already use, then move to a database as data grows.
Does it work on a phone?
Yes. Dashboards are responsive for desktop, tablet and phone.
Is our data safe?
Access uses role-based logins over encrypted HTTPS, and data is backed up regularly. The server can be where you choose.
How is this different from Looker Studio or Power BI?
Those tools are good and we sometimes use them. A custom dashboard makes sense when you need data entry, special permissions, views for outside users, or no per-user licence fees.